Dashboard
This module allows you to configure dashboards in the application. You can define multiple dashboards — built-in and iframe — each shown as its own tab, in the order declared, with its own set of metrics and settings. Currently supported dashboard types are:
BUILT_IN: A built-in dashboard with customizable metrics.IFRAME: An iframe dashboard that can embed external content.
Each dashboard has a required identifier: the /dashboard/:identifier route key and the leaf of the tab
title's translation key. The tab title is resolved back-end side from BACK_END.VALUES.DASHBOARDS.<identifier>.label
(a white-label-overridable back-end translation, the same convention as bulk-action and field-value labels); when
no translation is configured the identifier itself is shown. The identifier must be unique across all dashboards
of the FSP and must not contain a translation-key prefix. An iframe dashboard keeps a separate
providerIdentifier that points at its Superset provider.
Tab visibility. Each dashboard accepts an optional roles list (empty = visible to all): a tab whose roles
do not match the user's active roles is not listed at all, for built-in and iframe dashboards alike. A built-in
tab additionally requires the user to see at least one of its metrics (see the per-metric roles below), so a
board whose every metric is hidden disappears with it.
Settings
Settings Configuration
Examples
Settings Example
{
    "dashboards": [
         {
            "type": "BUILT_IN",
            "identifier": "built-in", // route key + tab-title TR-key leaf (BACK_END.VALUES.DASHBOARDS.built-in.label); unique per FSP
            "metrics": [
               {
                 "metric": "DOSSIER_FILTER", // metric type
                 "settings": {...}, // optional settings of the metric
                 "translations": { // translations for the title of the metric
                     "en": {
                         "label": "Ongoing review dossiers FI"
                         }
                   }
               },
               {
                 "metric": "DOSSIER_COUNT",
                 "remove": true
               }
            ]
        },
        {
            "type": "IFRAME",
            "identifier": "sla", // route key + tab-title TR-key leaf (BACK_END.VALUES.DASHBOARDS.sla.label)
            "providerIdentifier": "SupersetDashboardProviderIdentifier" // Superset provider reference
        }
    ]
}
- BUILT_IN
- IFRAME
Built-in dashboard
The Harmoney built in dashboard settings contains various metrics providing useful insights into the data that is available to the user within their own whitelabel/FSP context.
-
- 1.1 Role-based metric visibility
- 1.2 How to configure an alternate version of a default metric
- 1.3 Generic metrics
- 1.3.1 Dossier count
- 1.3.3 Dossier status V2
- 1.3.5 Dossier assignee V2
- 1.3.6 Dossier assigned
- 1.3.7 Dossier party type
- 1.3.8 Dossier time updated
- 1.3.9 Dossier service
- 1.3.10 Dossier RBA rating
- 1.3.11 Investment profile age
- 1.3.12 Client party type
- 1.3.13 Person status
- 1.3.14 Party individual expired proof of ID
- 1.3.15 Person creation time
- 1.3.16 Dossier owner
- 1.3.17 Dossier aggregation
Configuring metrics
The configuration of all metrics is defined in the settings of the FINANCIAL_SP_DASHBOARD module. The dashboard settings have a metrics field that contains a list of metric configurations. Each metric configuration represents a single metric in the dashboard.
Dashboard settings example
{
    "dashboards": [ {
        "type": "BUILT_IN",
        "identifier": "built-in",
        "metrics": [
            {
              "metric": "DOSSIER_FILTER", // metric type
              "settings": {...}, // optional settings of the metric
              "translations": { // translations for the title of the metric
                  "en": {
                      "label": "Ongoing review dossiers FI"
                      }
                }
            },
            {
              "metric": "DOSSIER_COUNT",
              "remove": true
            }
        ]
    }]
}
Multiple built-in dashboards
You can declare more than one built-in dashboard. Each becomes its own tab, in the order declared. Its
identifier is the route key and the leaf of the tab-title translation key
(BACK_END.VALUES.DASHBOARDS.<identifier>.label), so identifiers must be unique within the
FSP. A tab is shown only when the dashboard's optional roles allow the user (empty = everyone) and their
active roles allow at least one of its metrics (see role-based metric visibility).
The example below configures a production board (restricted to managers via its roles) and a
quality board (visible to everyone):
{
    "dashboards": [
        {
            "type": "BUILT_IN",
            "identifier": "production",
            "roles": ["PARTNER_MANAGER"],
            "metrics": [
                {
                    "metric": "DOSSIER_COUNT"
                },
                {
                    "metric": "DOSSIER_ASSIGNEE_V2"
                }
            ]
        },
        {
            "type": "BUILT_IN",
            "identifier": "quality",
            "metrics": [
                {
                    "metric": "DOSSIER_STATUS_V2"
                }
            ]
        }
    ]
}
An existing single built-in dashboard is migrated in place to the identifier built-in (its former label is
dropped), matching the historic /dashboard/built-in route and the shipped "Built in" tab title, so it keeps
working unchanged. You only need to make identifiers distinct once you declare a second dashboard.
Role-based metric visibility
Each metric configuration can include an optional roles array that controls which users can see that metric based on their active roles.
How it works:
- If
rolesis not specified (or is an empty array), the metric is visible to all users regardless of their roles - If
rolesis specified, the metric is only visible to users who have at least one of the specified roles active - When a user has multiple active roles, their effective roles for viewing metrics is the intersection of:
- The user's currently active roles
- The metric's configured
rolesarray (if specified)
Users can have multiple active roles simultaneously. When this happens, the user will see all metrics that match any of their active roles. This means the dashboard shows the "least restrictive view" - the broadest set of metrics across all active roles.
How to configure an alternate version of a default metric
To customize a default metric you can configure an additional metric configuration for that default metric that contains settings or translations according to your requirements.
For example, we can adapt the DOSSIER_STATUS default metric to only show the dossier count for statuses DONEand CLOSED. In this case, the dashboard settings would look like the following:
{
    "dashboards": [ {
        "type": "BUILT_IN",
        "identifier": "built-in",
        "metrics": [
            {
              "metric": "DOSSIER_STATUS",
              "remove": true
            },
            {
              "metric": "DOSSIER_STATUS",
              "settings": {
                  "status": [
                      "DONE",
                      "CLOSED"
                  ]
                },
              "translations": {
                  "en": {
                      "label": "Amount of dossiers closed or done"
                    }
                }
            }
        ]
    }]
}
Generic metrics
Generic metrics are hard-coded metrics that use specific queries to retrieve their data. These metrics are by default not displayed in the dashboard, so you’ll need to explicitly configure them in the dashboard settings. Some generic metrics can be changed by configuring custom settings for that metric. See each metric type for more info on what custom configurations are possible.
- Dossier count
- Dossier status
- Dossier assignee
- Dossier assigned
- Dossier party type
- Dossier time updated
- Dossier service
- Dossier RBA rating
- Investment profile age
- Client party type
- Person status
- Party individual expired proof of ID
- Person creation time
- Dossier owner
Dossier count
A metric displaying the total amount of dossiers that exist within the current FSP of the user. Aside from the total count, the metric also displays the amount of dossiers that are “active” and the amount of dossiers that are “ongoing”. The “active” dossiers are dossier in either APPROVED, ACCEPTED or DONE. The “ongoing” dossiers are the dossiers that are in any status other than closed or the last status of the dossier's lifecycle.
Metric enum: DOSSIER_COUNT
Visual example:
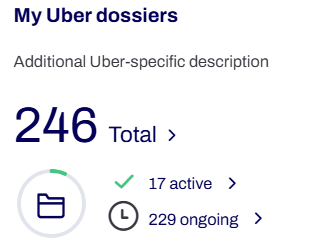
Settings object: MetricDossierCountSetting
The dossier count metric allows to configure 2 dossier filters. One for the ongoing dossiers and another for the active dossiers. Both dossier filters are REQUIRED to have some dossier statuses configured!
For more info on what can be configured in a dossier filter, see Dossier Filter.
For example, instead of showing the default total dossier count and ongoing/active dossier counts, you can configure a dossier count metric that only shows total/ongoing/active dossier counts for dossiers with dossier type INVESTMENT.
Settings JSON
{
        "ongoingDossierFilter": { ... (FinancialSpDossierFilter)},
        "activeDossierFilter": { ... (FinancialSpDossierFilter)}
}
Example
{
      "metric": "DOSSIER_COUNT",
      "settings": {
        "ongoingDossierFilter": {
          "type": [
            "KNOW_YOUR_CUSTOMER"
          ],
          "status": [
            "OPEN",
            "IN_PROGRESS",
            "SUBMITTED",
            "READY_FOR_REVIEW",
            "INPUT_NEEDED",
            "READY_FOR_REVIEW",
            "REVIEWED"
          ]
        },
        "activeDossierFilter": {
          "type": [
            "KNOW_YOUR_CUSTOMER"
          ],
          "status": [
            "DONE",
            "CLOSED"
          ]
        }
      },
      "translations": {
        "en": {
          "label": "Number of dossiers"
        }
      }
    }
Dossier status V2
A metric displaying the number of dossiers grouped by dossier status. By default, this metric will only include dossier data from dossiers that are assigned to the current user. Note legacy behavior on back-office side: the metric doesn't take into account the settings and displays all dossiers by status or for partner analyst users only the dossiers assigned to them.
Metric enum: DOSSIER_STATUS_V2
Visual example:
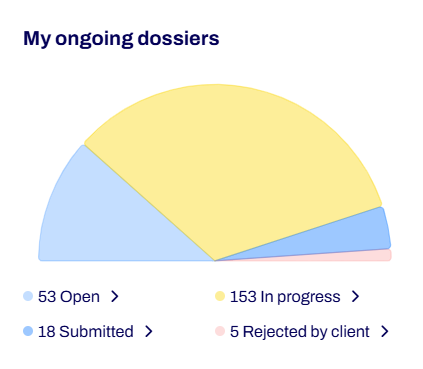
Settings object: MetricDossierStatusSetting
The dossier status metric allows to configure a dossier filter using property dossierFilter. This dossier filter must contain some dossier statuses.
For more info on what can be configured in a dossier filter, see Dossier Filter.
By default, this metric will only include dossier data from dossiers that are assigned to the current user.
It's possible to include more dossiers (not assigned to the current user) by configuring setting showOnlyDossiersAssignedToCurrentUser as false.
For example, you don’t want to see the default dossier status metric that displays all applicable dossier statuses of the FSP context. Instead, you only want the metric to display a specific subset of dossier statuses.
Settings JSON
{
        "dossierFilter": { ... (FinancialSpDossierFilter)},
        "showOnlyDossiersAssignedToCurrentUser": boolean   // Optional, default true
}
Dossier assignee V2
A metric displaying the number of dossiers grouped by assignee. The amount of assignees displayed is configurable.
Metric enum: DOSSIER_ASSIGNEE_V2
Required module: FINANCIAL_SP_DOSSIERS
Visual example:
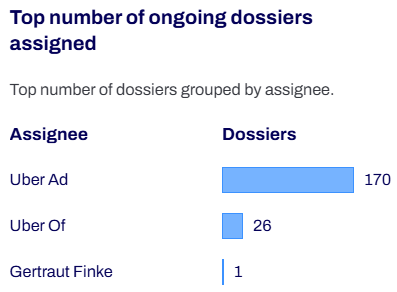
Settings object: MetricDossierAssigneeSettings
The dossier assignee metric allows to configure a dossier filter. This dossier filter must contain some dossier statuses.
For more info on what can be configured in a dossier filter, see Dossier Filter.
By default, the 5 assignees with the most dossiers assigned will be displayed in the metric.
If you want the metric to display more or less assignees, configure setting amountOfAssignees.
Example
{
    "dashboards": [ {
        "type": "BUILT_IN",
        "identifier": "built-in",
        "metrics": [
            {
              "metric": "DOSSIER_ASSIGNEE_V2",
              "settings": {
                  "dossierFilter": {
                    "status": [
                      "OPEN",
                      "IN_PROGRESS",
                      "SUBMITTED"
                    ]
                  },
                "amountOfAssignees": 10
                },
              "translations": {
                  "en": {
                      "label": "Amount of dossiers grouped by assignee"
                    }
                }
            }
        ]
    }]
}
Dossier assigned
A metric displaying the number of dossiers assigned to the current user.
Metric enum: DOSSIER_ASSIGNED
Required module: FINANCIAL_SP_DOSSIERS
Settings object: currently not supported!
Dossier party type
A metric displaying the number of dossiers grouped by party type of the dossier client.
Metric enum: DOSSIER_PARTY_TYPE
Required module: FINANCIAL_SP_DOSSIERS
Visual example:
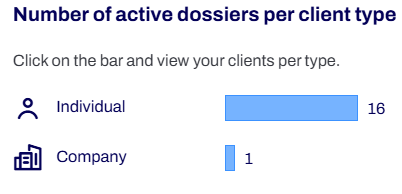
Settings object: currently not supported!
Dossier time updated
A metric displaying the total amount of premiums for the dossiers in active statuses grouped by the dossier time updated.
Metric enum: DOSSIER_TIME_UPDATED
Required module: FINANCIAL_SP_DOSSIERS
Visual example:
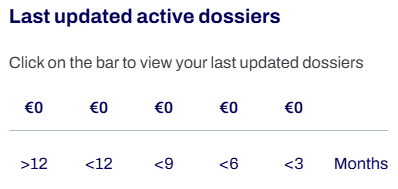
Settings object: currently not supported!
Dossier service
A metric displaying the number of dossiers grouped by the dossier service.
Metric enum: DOSSIER_SERVICE
Required module: FINANCIAL_SP_DOSSIERS
Visual example:
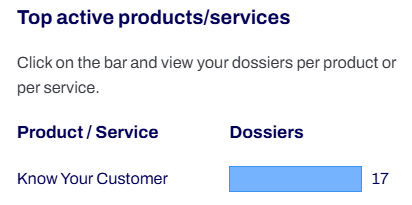
Settings object: currently not supported!
Dossier RBA rating
A metric displaying the number of active dossiers grouped by RBA rating.
Metric enum: DOSSIER_RBA_RATING
Required module: FINANCIAL_SP_DOSSIERS & RBA
Visual example:
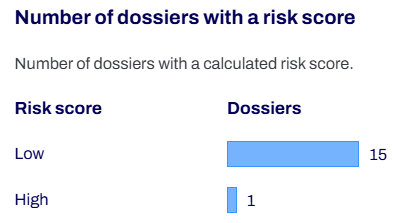
Settings object: currently not supported!
Investment profile age
A metric displaying the number of active dossiers grouped by the age of the most recently completed submission group.
Metric enum: INVESTMENT_PROFILE_AGE
Required module: FINANCIAL_SP_DOSSIERS
Visual example:
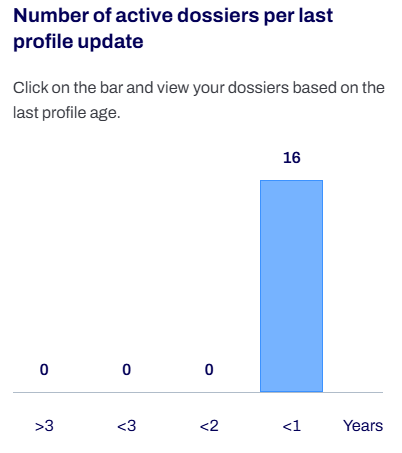
Settings object: currently not supported!
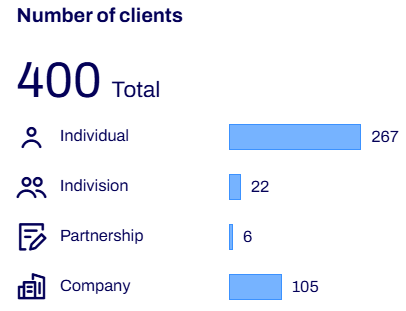
Client party type
A metric displaying the total number of dossier clients and additionally the number of dossier clients grouped by party type.
Metric enum: CLIENT_PARTY_TYPE
Required module: FINANCIAL_SP_PARTIES
Visual example:
Settings object: currently not supported!
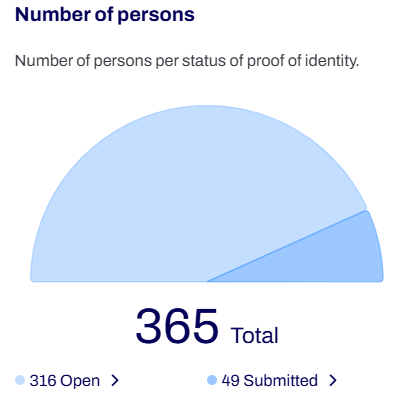
Person status
A metric displaying the total number of persons and additionally the number of persons grouped by their proof of ID status.
Metric enum: PERSON_STATUS
Required module: FINANCIAL_SP_PARTIES & IDENTITY
Visual example:
Settings object: currently not supported!
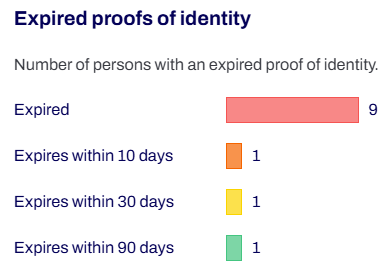
Party individual expired proof of ID
A metric displaying the number of individuals based on their proof of ID expiration date.
Grouped in 4 segments:
- persons with expired PoID (= expiry date < now)
- persons with PoID expires in 10 days (= expiry date < now + 10 days)
- persons with PoID expires in 30 days, but doesn't expire in more than 10 days (= expiry date < now + 30 days)
- persons with PoID expires in 90 days, but doesn't expire in more than 30 days (= expiry date < now + 90 days)
Metric enum: PARTY_INDIVIDUAL_EXPIRED_POID
Required module: FINANCIAL_SP_PARTIES & IDENTITY
Visual example:
Settings object: currently not supported!
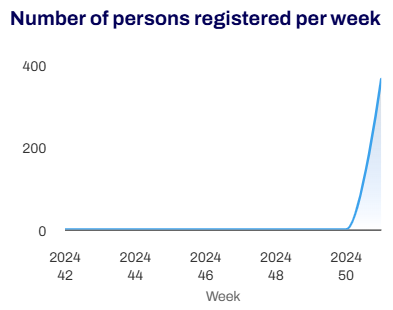
Person creation time
A metric displaying the number of persons created by the identity capture module and grouped by age (/week).
Metric enum: PERSON_CREATION_TIME
Required module: FINANCIAL_SP_PARTIES
Visual example:
Settings object: currently not supported!
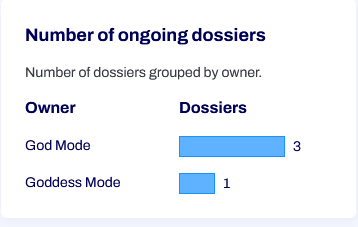
Dossier owner
A metric displaying the number of dossiers grouped by owner.
Metric enum: DOSSIER_OWNER
Required module: FINANCIAL_SP_DOSSIERS
Visual example:
Settings object: FinancialSpDossierFilter
The dossier assignee metric allows to configure a dossier filter. This dossier filter must contain some dossier statuses.
For more info on what can be configured in a dossier filter, see Dossier Filter.
Dossier aggregation
A metric displaying the total or the average of a numeric field of the dossier, as one bar per configured field. Where the other metrics count dossiers, this one adds up a number stored on them.
Metric enum: DOSSIER_AGGREGATION
Required module: FINANCIAL_SP_DOSSIERS
Settings object: AggregationMetricDossierFilterSettings
Settings Configuration
field names one of the dossier's two metadata maps and the key in it — metadata.CALLS_ANSWERED or externalDossierMetadata.CALLS_ANSWERED. Nothing else can be aggregated, and a field naming anything else is a configuration error rather than a silent zero.
The total or the average is computed by the database, one query per bar, so a tile never loads the dossiers it reports on. A dossier that does not carry the key is left out, which is why an AVERAGE divides by the dossiers that actually carry a value; a key holding something that is not a number counts as zero and is divided by. Values carry at most two decimals.
A dossierFilter on open tasks or on due diligence results is refused here: both match a dossier once per task or per check, which would add that dossier's value more than once. A filter on the due diligence of the client (clientDueDiligenceResults) is allowed, as it matches each dossier at most once. Every other criterion works as it does on a counting tile, see Dossier Filter.
Custom metric
Custom metrics are purely configuration-based. They query the database based on dossier filters configured in the metric settings and display the dossier count of each query result as a bar in a horizontal bar chart. The FINANCIAL_SP_DOSSIERS module needs to be active in order to display the custom metrics in the dashboard.
Each custom metric uses the metric enum DOSSIER_FILTER.
How to configure a custom metric
The configuration of all metrics is defined in the settings of the FINANCIAL_SP_DASHBOARD module. The dashboard settings have a metrics field that contains a list of metric configurations. Each metric configuration represents a single metric in the dashboard.
A custom metric requires a MetricDossierFilterSettings object to be configured in the metric configuration settings. These metric dossier filter settings contain an entries field with a list of “dossier filter entries”. These dossier filter entries each represent a single bar of the bar chart. Each dossier filter entry defines a dossier filter to be used to query the dossiers along with the color of the bar and the translations used for the label of the bar. Two optional settings tune the chart: ordering controls the order of the bars, and percentageDenominatorFilter adds a percentage next to each bar's count (see Ordering and percentage below).
dossierFilter configuration: Dossier Filter
Here is a configuration example of how to configure the dashboard settings to show a custom metric that displays the amount of dossiers on the FSP split between investment, insurance and KYC dossiers:
{
    "dashboards": [{
        "type": "BUILT_IN",
        "identifier": "built-in",
        "metrics": [
            {
              "metric": "DOSSIER_FILTER", // metric type
              "settings": {
                  "entries": [
                      {
                          "dossierFilter": {
                              "type": ["INVESTMENT"]
                          },
                          "color": "RED", // color of the bar
                          "translations": { // Translation for the bar label
                            "en": {
                                "label": "Total investment dossiers"
                              }
                          }
                      },
                      {
                          "dossierFilter": {
                              "type": ["INSURANCE"]
                          },
                          "color": "GREEN",
                          "translations": {
                            "en": {
                                "label": "Total insurance dossiers"
                              }
                          }
                      },
                      {
                          "dossierFilter": {
                              "type": ["KNOW_YOUR_CUSTOMER"]
                          },
                          "color": "BLUE",
                          "translations": {
                            "en": {
                                "label": "Total KYC dossiers"
                              }
                          }
                      }
                  ]
              },
              "translations": { // translations for the title of the metric
                  "en": {
                      "label": "Amount of investment, insurance and KYC dossiers"
                      }
                }
            }
        ]
    }]
}
Filtering on the client's due diligence
A bar can count dossiers on the due diligence of their client, with the clientDueDiligenceResults field of the dossier filter. Each entry maps a due diligence parameter to a condition on the client's check for that parameter:
systemResults: the screening results to match, as the provider stores them (e.g.YES). Omitted or empty, the screening result is ignored: any value matches.manualResults: the manual results to match. Omitted, the manual result is ignored: any value or none matches. An empty list means no manual result may be present, i.e. the check has not been assessed yet.
Both conditions apply to the same check, and the manual result does not replace the screening result here. A dossier whose client has no check for the parameter is never counted. Unlike dueDiligenceResults, which reads the dossier's own due diligence and ignores an empty list, an empty manualResults list is a condition.
The tile below works as a review queue: each bar counts the migrated dossiers whose client is a hit for that parameter and still has to be assessed. As soon as a user enters a manual result for the parameter, whatever its value, the dossier leaves the bar.
{
    "metric": "DOSSIER_FILTER",
    "settings": {
        "entries": [
            {
                "dossierFilter": {
                    "lifecycles": ["MIGRATED_PARTY"],
                    "clientDueDiligenceResults": {
                        "PEP": { "systemResults": ["YES"], "manualResults": [] }
                    }
                },
                "translations": { "en": { "label": "PEP" } }
            },
            {
                "dossierFilter": {
                    "lifecycles": ["MIGRATED_PARTY"],
                    "clientDueDiligenceResults": {
                        "SANCTION_LIST": { "systemResults": ["YES"], "manualResults": [] }
                    }
                },
                "translations": { "en": { "label": "Sanction list" } }
            }
        ]
    },
    "translations": { "en": { "label": "Migrated dossiers with a hit to be assessed" } }
}
The filter counts dossiers, not clients: a client on three matching dossiers counts three times. The dossier list opened from a bar only applies the condition for users allowed to read the due diligence of parties, so give that permission to the roles that see the tile; otherwise the list shows more dossiers than the bar counts. Rescreening a client can clear a manual result that is not locked, which brings the dossier back into the bar when the new screening result still matches.
Ordering and percentage
Both settings are optional and sit next to entries in the metric settings.
By default the bars keep the order in which the entries are declared. Set ordering to sort the bars by their computed dossier count instead:
NONE(default): keep the entries in the order they are listed.COUNT_DESC: highest count first.COUNT_ASC: lowest count first.
Add a percentageDenominatorFilter — itself a dossier filter — to also show a percentage next to each bar's count. Each bar then displays count (percentage%), where the percentage is that bar's dossier count divided by the number of dossiers matching the denominator filter. When the setting is omitted, only the count is shown. Because a dossier can match several entries but the denominator only once, the percentages do not necessarily add up to 100%.
{
    "metric": "DOSSIER_FILTER",
    "settings": {
        "ordering": "COUNT_DESC",
        "percentageDenominatorFilter": {
            "type": ["INVESTMENT", "INSURANCE", "KNOW_YOUR_CUSTOMER"]
        },
        "entries": [
            // ...same entries as above...
        ]
    }
}
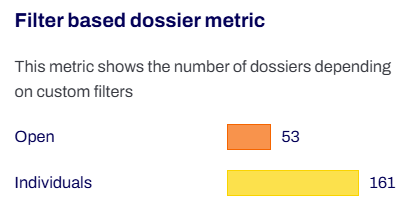
Custom metric colors
Currently the following values are supported as color for a metric “bar”:
RED, ORANGE, ORANGE_DARK, ORANGE_LIGHT, YELLOW, GREEN, BLUE, BLUE_LIGHT, BLUE_LIGHTER
Visual example
Examples
Settings Configuration
Examples
Iframe dashboard
In order to define dashboards making use of an iframe, you need to use the IFRAME type and provide a providerIdentifier
that points to a configured provider.
Module configuration
In order to define an iframe dashboard, you need to provide the following configuration parameters:
type:IFRAMEidentifier: The dashboard's route key and the leaf of the tab-title translation keyBACK_END.VALUES.DASHBOARDS.<identifier>.label(white-label overridable; falls back to the identifier when untranslated). Must be unique across the FSP's dashboards.providerIdentifier: The identifier of the provider.roles(optional): The roles that are allowed to see this dashboard tab; leave empty to allow all roles.
See Dashboard Providers for more information on the available providers.
Example
{
    "dashboards": [
         {
            "type": "IFRAME",
            "identifier": "sla",
            "providerIdentifier": "IframeDashboardProviderIdentifier"
        }
    ]
}